To reproduce this graph first we will import its data file: Top_Pet_Peeves_Of_Dog_Owners_Nationwide.csv
library(tidyverse)
Warning: package 'ggplot2' was built under R version 4.4.3
Warning: package 'tibble' was built under R version 4.4.3
Warning: package 'tidyr' was built under R version 4.4.3
Warning: package 'readr' was built under R version 4.4.3
Warning: package 'purrr' was built under R version 4.4.3
Warning: package 'dplyr' was built under R version 4.4.3
Warning: package 'lubridate' was built under R version 4.4.3
── Attaching core tidyverse packages ──────────────────────── tidyverse 2.0.0 ──
✔ dplyr     1.2.0     ✔ readr     2.2.0
✔ forcats   1.0.1     ✔ stringr   1.6.0
✔ ggplot2   4.0.2     ✔ tibble    3.3.1
✔ lubridate 1.9.5     ✔ tidyr     1.3.2
✔ purrr     1.2.1
── Conflicts ────────────────────────────────────────── tidyverse_conflicts() ──
✖ dplyr::filter() masks stats::filter()
✖ dplyr::lag()    masks stats::lag()
ℹ Use the conflicted package (<http://conflicted.r-lib.org/>) to force all conflicts to become errors
library(scales)
Attaching package: 'scales'

The following object is masked from 'package:purrr':

    discard

The following object is masked from 'package:readr':

    col_factor
library(here)
here() starts at /Users/ayllaermland/Downloads/BIOS8060E/AyllaErmland-portfolio
Rows: 10 Columns: 2
── Column specification ────────────────────────────────────────────────────────
Delimiter: ","
chr (2): Pet peeve, Percentage of respondents

ℹ Use `spec()` to retrieve the full column specification for this data.
ℹ Specify the column types or set `show_col_types = FALSE` to quiet this message.
Rows: 50 Columns: 4
── Column specification ────────────────────────────────────────────────────────
Delimiter: ","
chr (4): State, ~~~Pet Peeve #1~~~, ~~~Pet Peeve #2~~~, ~~~Pet Peeve #3~~~

ℹ Use `spec()` to retrieve the full column specification for this data.
ℹ Specify the column types or set `show_col_types = FALSE` to quiet this message.
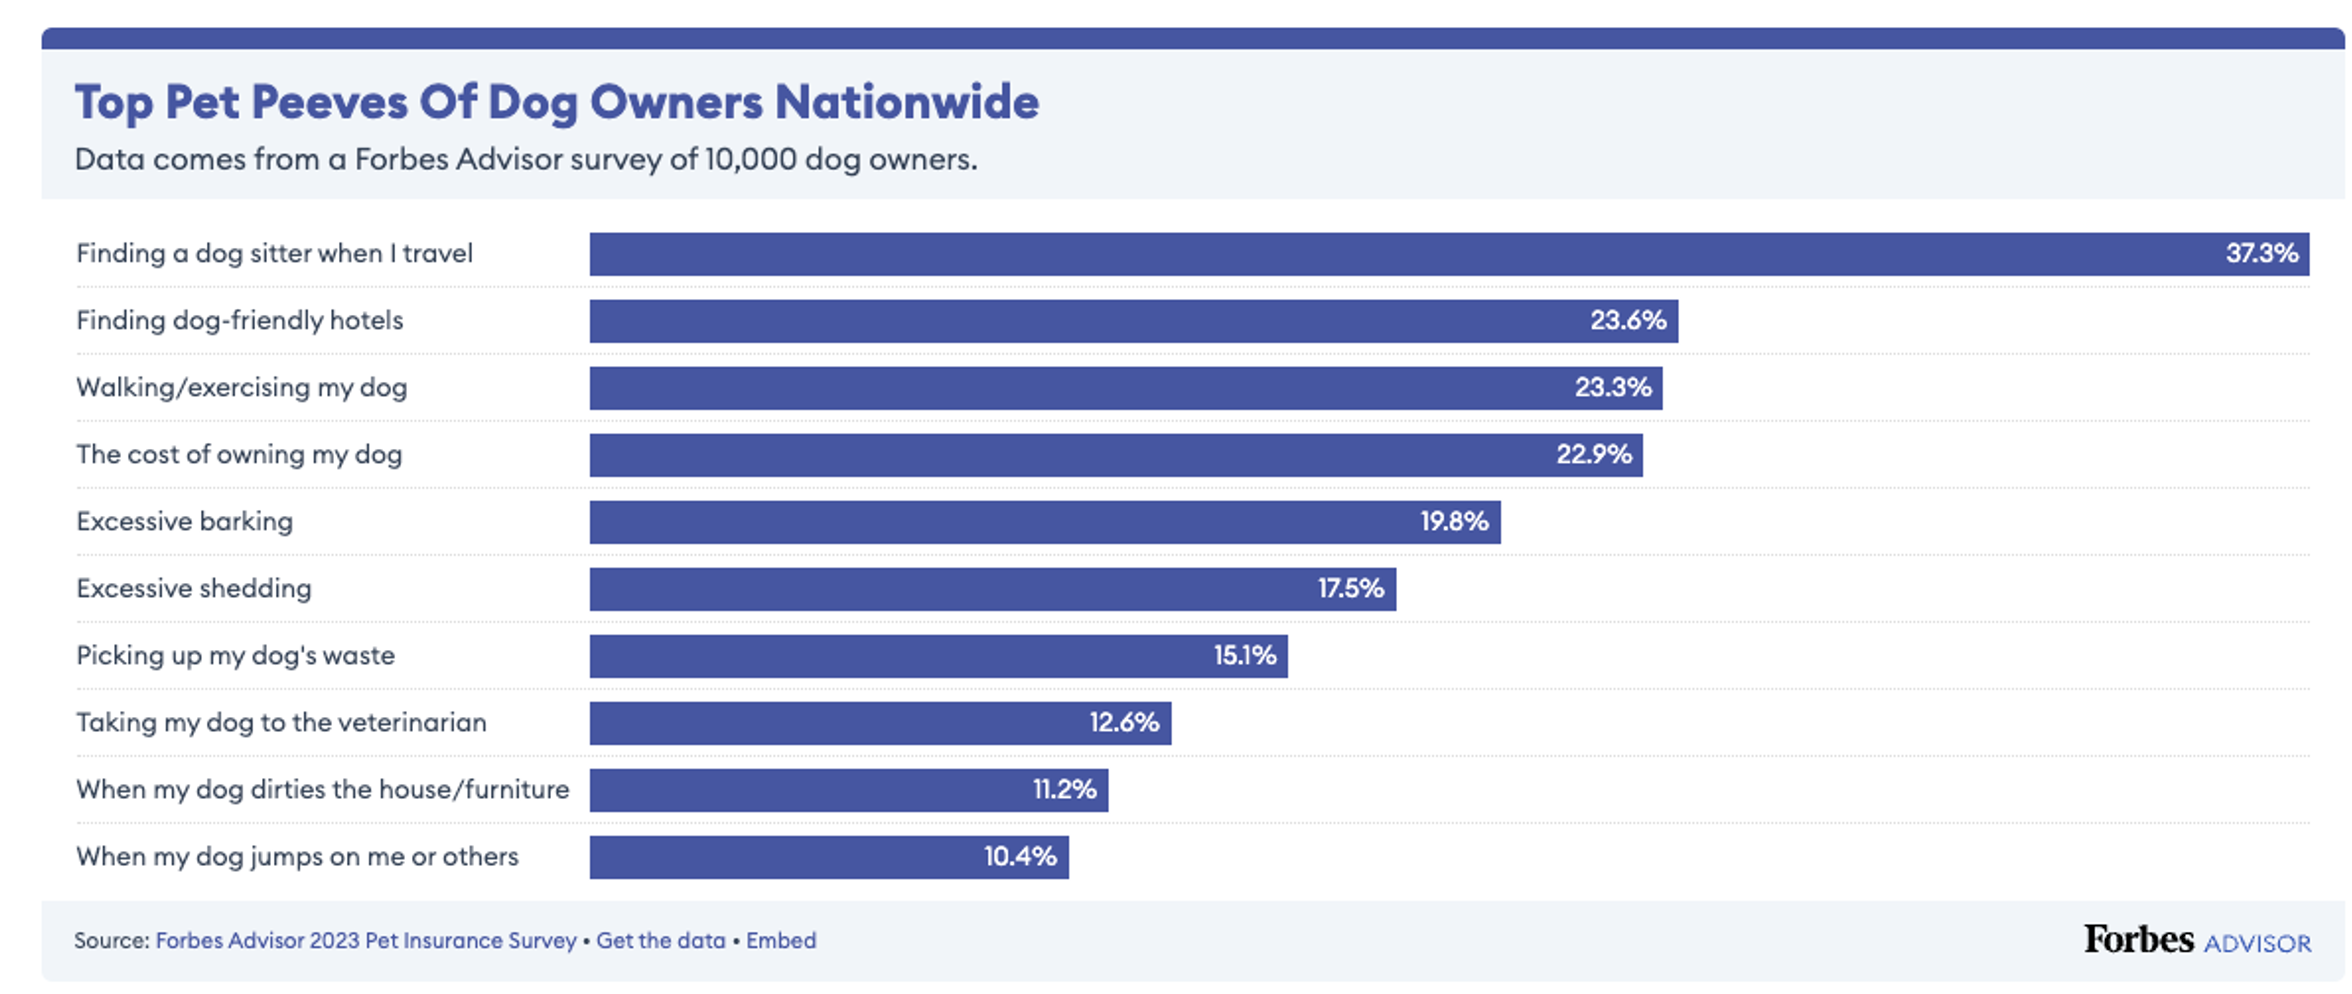
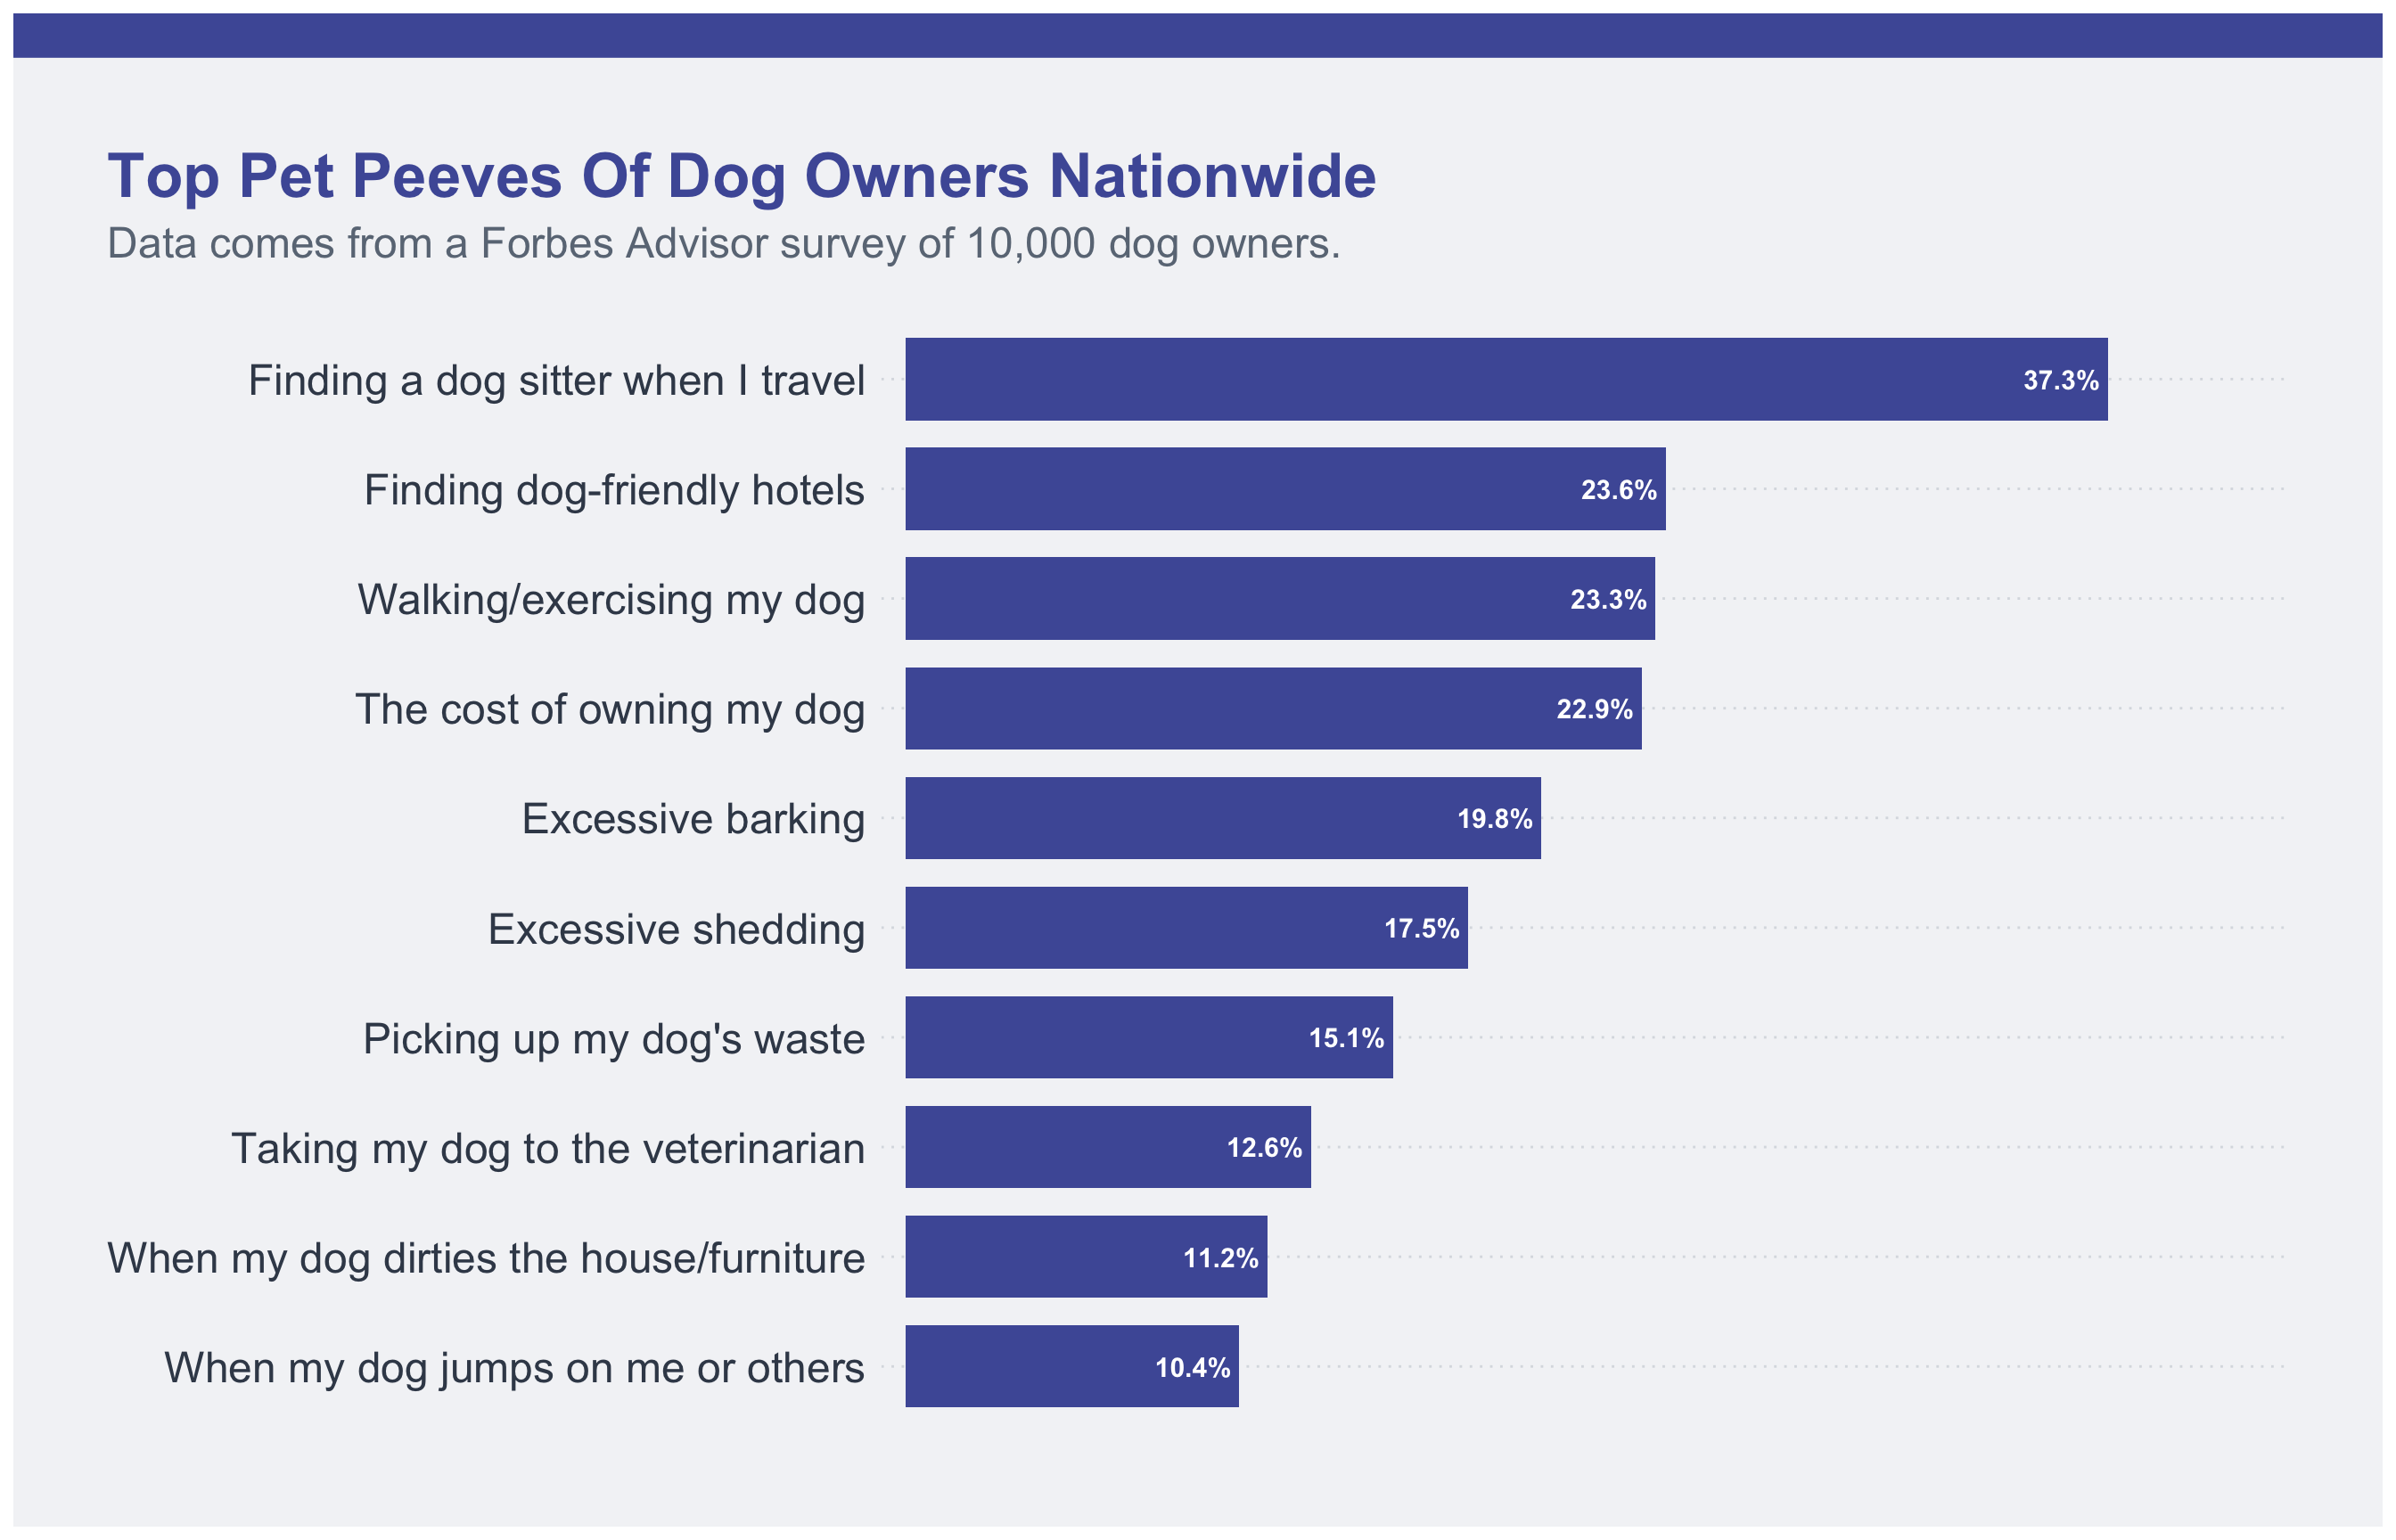
Recreate the figure from this site https://www.forbes.com/advisor/insurance/pet-insurance-pet-peeves-by-state/ more specifically the Top Pet Peeves Of Dog Owners Nationwide, using the csv file already downloaded. csv formatting row example:Pet peeve; Percentage of respondents;Finding a dog sitter when I travel; 37.34%The graph needs to be generated using R and ggplot2, the graph have a top bar in blue and bold title in blue also.
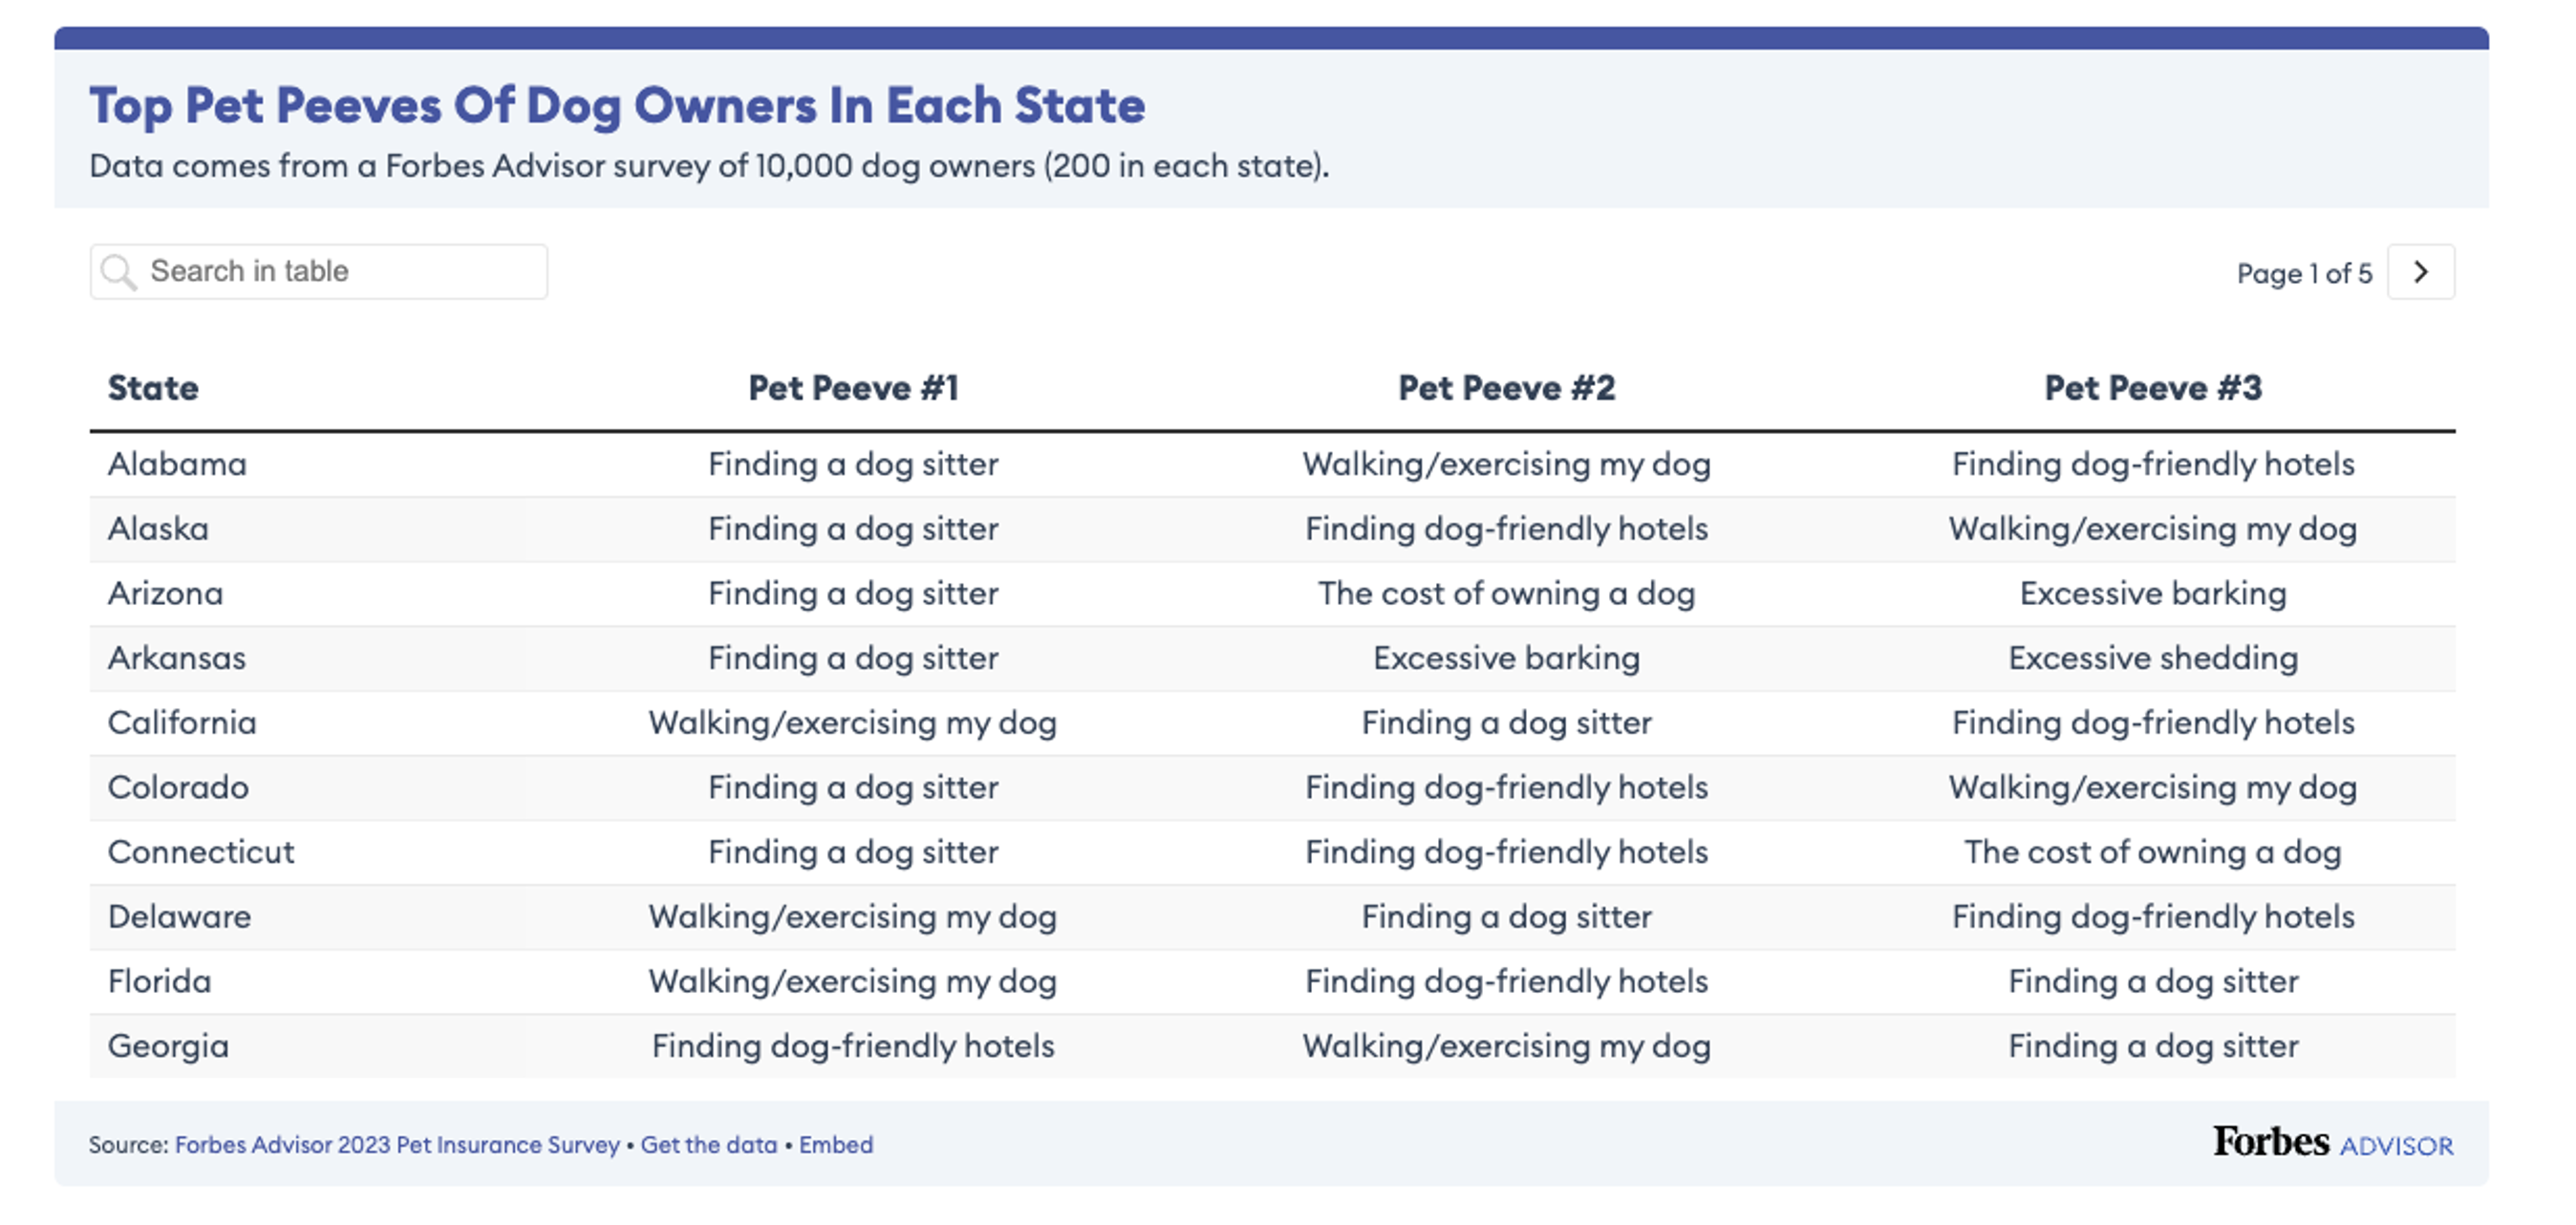
For creating interactive footnotes in the table: For the footnotesm I want “[TEXT]” clickable/interactive in the [LOCATION] linking to [URL]. How do I do that?